
Introduction
In part 1 of the series, we successfully got an instance of Home Assistant running on a Raspberry Pi, integrated 2 Google Chromecast devices, a Shelly device and a Tasmota device. We skipped over the wiring and set up of the sensors, and went straight into the integration of an already set up device into Home Assistant.
In part 2 we looked at how to do the wiring and preparation of the sensors to prepare them to be added into Home Assistant.
Part 3 will guide you through the installation and integration process to allow you to store and visualize your time series sensor data using beautiful Grafana graphs in Home Assistant. Two add-ons will be used for this, Influx DB to store the series data in a time series database. As well as Grafana to link to the Influx DB database and display the required information.
What is the software we will use?
Influx DB
Influx DB is an open-source time series database used extensively for real-time analytics, operations monitoring, various other fields, and for our purpose in this blog, the so called “internet of things” sensor data. Influx DB also has visualization capability, but we’re going to achieve that using Grafana.
Grafana
Grafana is an open-source analytics and interactive visualization web application which offers end users the ability to create complex and beautiful monitoring dashboards. Grafana was designed to target time series databases such as Influx DB.
Pre-requisites
As this blog falls into our larger series of Home Assistant blogs, this blog will assume that you already have a working home assistant setup up and running. Should you have followed along with the irrigation controller blog, you will have everything ready to proceed with this one.
If you did not do that one, your only pre-requisite is to have some form of sensor connected to your Home Assistant. This can be anything from a temperature and humidity sensor to a power consumption monitor.
Installing InfluxDB and Grafana
Both InfluxDB as well as Grafana are installed as Add-Ons to Home Assistant.
InfluxDB
Navigate to the settings tab, click on Add-Ons, you will see your currently installed add-ons.

On the bottom right hand side of the screen, is a blue button called “ADD-ON STORE. Click on it to go to the store.

In the search bar of the store, search for “InfluxDB”, and add it to the store.

Click INSTALL, and wait for the installation to finish. Once the installation has finished, set your Start on boot, watchdog and show in sidebar options as active.

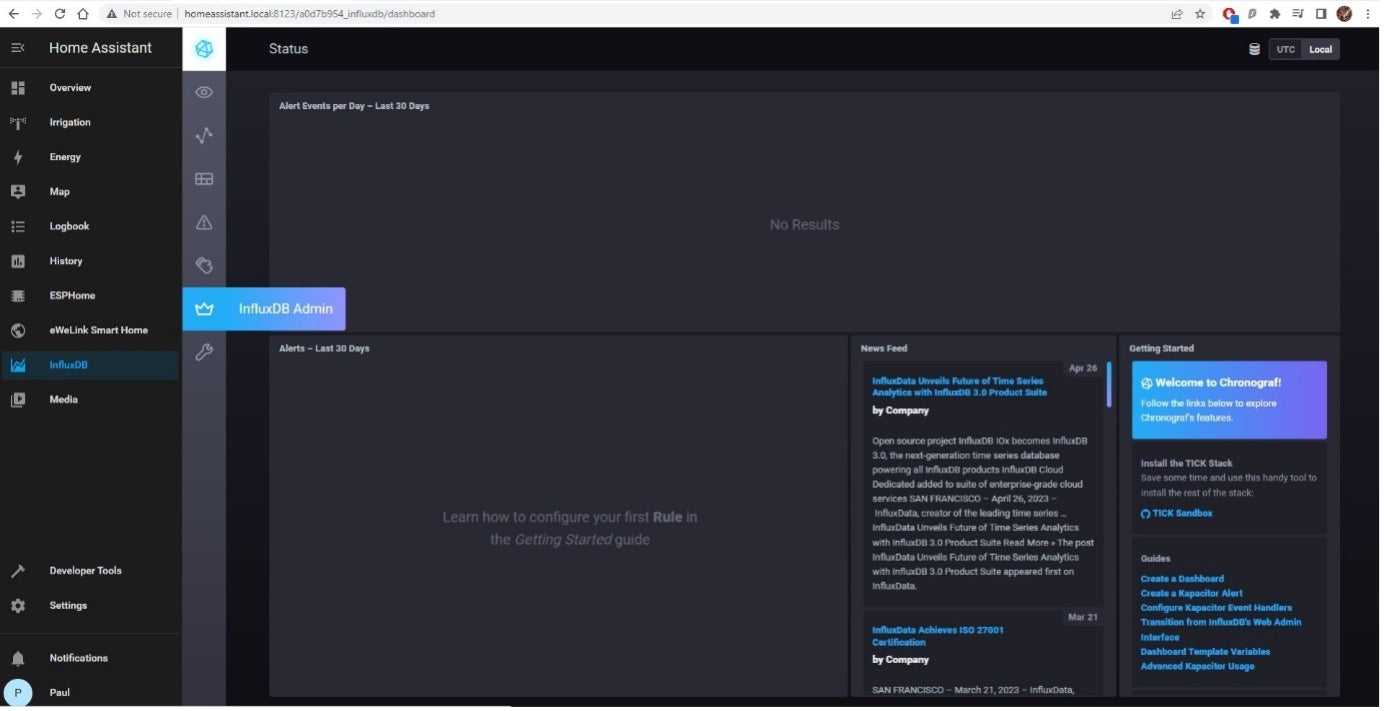
The sidebar should now show InfluxDB as well. Click on it to navigate to your InfluxDB add-on.
Once there, click on the InfluxDB Admin tab.
From there, click on the “users” tab on the top, and click “create user”. You will get the following screen.

You can choose any username and password. For this blog I’ve kept it descriptive and used HomeAssistant as the Username and database name.
Next navigate to Databases, and click on “create database”. Give the database any name, in this case I gave it HomeAssistant.

After database is created, ensure the duration is set to infinity. The newly created database should look as below.

Next, we need to ensure that our database has the required permissions. Proceed to Users, click on the HomeAssistant user we created earlier, and you should see the HomeAssistant database. There should be an internal database as well as the HomeAssistant database. Ensure that the HomeAssistant user has both read and write access to the HomeAssistant Database.

Finally, we need to add the database with its username and password and address to the yaml configuration file of Home Assistant.
In an earlier blog we installed Studio Code Server to make the configuration file editing easier. If you don’t have it installed, you can install it from the add on store.
Click on Studio Code Server in your sidebar, click on the “configurations.yaml” file, and add the following information:
influxdb:
host: localhost ip address
port: 8086
database: HomeAssistant
username: HomeAssistant
password: your password
max_retries: 3
default_measurement: state

To activate and check your configuration, navigate to “developer tools” in the sidebar, and click on “check configuration”.

Go back to your InfluxDB add on and click on “Explore”.
Make sure you have selected “HomeAssistant.autogen” and not “_internal.monitor”. You will now see all available tags from the time series data that is reporting to your home assistant.

Congratulations! You have successfully created a time series database using InfluxDB that runs alongside the internal database of Home Assistant. We will use this database to create beautiful dashboards in Grafana in the next section of this blog.
Grafana
Install Grafana from the add-on store exactly as we did in the previous section oof this blog with InfluxDB.

Once installed, navigate to Grafana in the sidebar.

Using the dropdown hamburger menu, navigate to Administration, and Data Sources. From here, select “Add new data source”.

Select InfluxDB as your datasource.
From here you can give the datasource a name or keep it as default “InfluxDB”.
Under the HTTP section, there is a URL text field. Enter your local Home Assistant IP Address in here, with the InfluxDB port of 8086.

The newly created datasource will now be available, but we still need to add a database name, username and password.
Enter the details you created when installing InfluxDB.

If everything is successful, you should get a message with a green tick stating the database is working and that some amount of measurements have been found.

Creating visualisations in Grafana
Now that we have a working time series database in InfluxDB, and have it linked successfully to Grafana, we can create our own dashboards!
First we need to create a new dashboard. In the Grafana add-on, navigate to Home->Dashboards, and select “new dashboard”

You can change the name of the dashboard at any time, or you can change it now by clicking on the gear symbol and changing the name from “new dashboard” to something more descriptive.
Click the big “+ Add visualization” button.

Ensure that the Data source is “InfluxDB”.
On the right hand side with “Panel options”, the default title is “Panel Title”, change that to something descriptive, in this example we’re using “Outside Temperature”.
Click on the “select measurement” button in the “from” tab.

We will select degrees C for the temperature panel. The “Outside Temperature” display will immediately change from “No data” to showing your lates datapoints. Save the panel by clicking on the Apply and save buttons on the top right.
Congratulations! You have a working dashboard that you can now edit and change and monitor. The time period can be changed from the dropdown that is default “Last 6 hours”. Opacity can be changed, line width, the type of graph, what to do with null values, or negative values, thresholds and many more!.
Summary
The main dashboard shows in Home Assistant shows a nice quick view, but with long term historical data in InfluxDB and the flexibility of Grafana dashboards, a lot more insight can be gained into your sensor data! Below is an example from my own Home Assistant setup:


1 comment
Marco
Good Afternoon,
My name is Marco, from The Akira Team – I just noticed your website through your Entireweb Website Listing, and wanted to get in touch with you right away.
We have a special offer for your website today, and that is 1st Page Rankings in all major search engines (That’s Google, Yahoo and Bing) + social media and video commercial advertising starting at just $29.99 which I am ABSOLUTELY certain will benefit your website and business, by bringing you LOTS of new customers, very very quickly.
Visit useakira.com if you want your website to be at the TOP of Google, Yahoo and Bing, AND we can get you started immediately. Or visit useakira.com/11yearexclusive.html in the next 12 hours for a HUGE half price offer + your 2nd year free of charge.
I look forward to hearing back from you.
Cheers!
Marco
The Akira Team
Executive Page One Relations
B-7(9629tehp6zv)